Morpho Risk Assessment: What Happens to $45M of WETH/USDC Debt if ETH Drops 20%?
Table of Contents
- TLDR
- Why This Assessment Exists
- The Market We Analyzed
- Historical Stress Event: August 5, 2024
- Borrower Impact Under ETH Price Shocks
- Base DEX Liquidity Simulation
- How Liquidation Cascades Form
- Oracle Behavior During Volatility
- Simulation Limitations
- Practical Recommendations
- Data Sources
- About Us
- FAQ
TLDR
- This Morpho risk assessment models the WETH/USDC market on Base using borrower data collected on January 27, 2026. Use it as a snapshot rather than a live solvency report.
- In the modeled book, a 17% ETH drop makes 8 positions liquidatable, representing about $2.2M of debt and roughly 820 WETH of collateral.
- A 20% ETH drop makes 12 positions liquidatable, representing about $5.51M of debt and roughly 2,074 WETH of collateral.
- Normal-condition Base DEX quotes suggested that liquidating around $5M of WETH collateral was absorbable with low quoted price impact, but that result depends on liquidity staying available during the crash.
- The first liquidation is small. Cascade risk comes from falling ETH price, thinner DEX liquidity, oracle update lag, and repeated collateral sales.
- Health factor 1.0 leaves no margin. For this market profile, a buffer above 1.3 gives more room against 20-25% ETH moves.
Why This Assessment Exists
Morpho Blue uses isolated lending markets. Each market has its own loan asset, collateral asset, oracle, interest rate model, and liquidation loan-to-value parameter. This contains risk to a specific market instead of sharing it across every asset in a larger lending pool. It also makes market-by-market analysis necessary.
This article is for readers searching for a Morpho liquidation risk assessment: borrowers using WETH as collateral, vault curators allocating USDC into Morpho markets, liquidators estimating sell pressure, and security teams reviewing oracle and liquidity assumptions. The question is narrow: if ETH falls sharply, how much of the WETH/USDC debt on Base becomes liquidatable, and can on-chain liquidity absorb the collateral sales?
Current conditions may differ. The borrower data was collected on January 27, 2026, and the swap quotes were collected on February 6, 2026. Positions, liquidity, interest rates, and oracle configurations can change quickly. The method combines borrower-level collateralization, historical price shocks, oracle behavior, and DEX depth rather than relying on total borrowed value alone.
Keep liquidatable debt separate from bad debt. Liquidatable debt means a position has crossed the liquidation threshold and can be repaid by a liquidator in exchange for collateral. Bad debt means the collateral cannot cover the debt after price movement, slippage, incentives, and execution costs. A market can have many liquidations without bad debt if liquidators can execute quickly and sell collateral into deep markets.
For broader context on why isolated lending markets are increasingly managed through curators and vaults, see our guide to DeFi vault curation. For a separate example of how oracle assumptions and vault accounting can transmit losses, see our breakdown of the Resolv vault curation incident.
The Market We Analyzed
The target market is a WETH collateral and USDC borrow market on Base, chain ID 8453. The analysis focuses on the largest active borrower positions visible in the collected snapshot.
| Parameter | Value | Source |
|---|---|---|
| Protocol | Morpho Blue | Morpho API |
| Network | Base | Chain ID: 8453 |
| Market | WETH collateral / USDC debt | Borrower snapshot |
| Total Borrowed | ~$45.56M | Collected: January 27, 2026 |
| Liquidation LTV (LLTV) | 86% | Market parameter |
| Active Borrowers Analyzed | 50 top positions | Collected: January 27, 2026 |
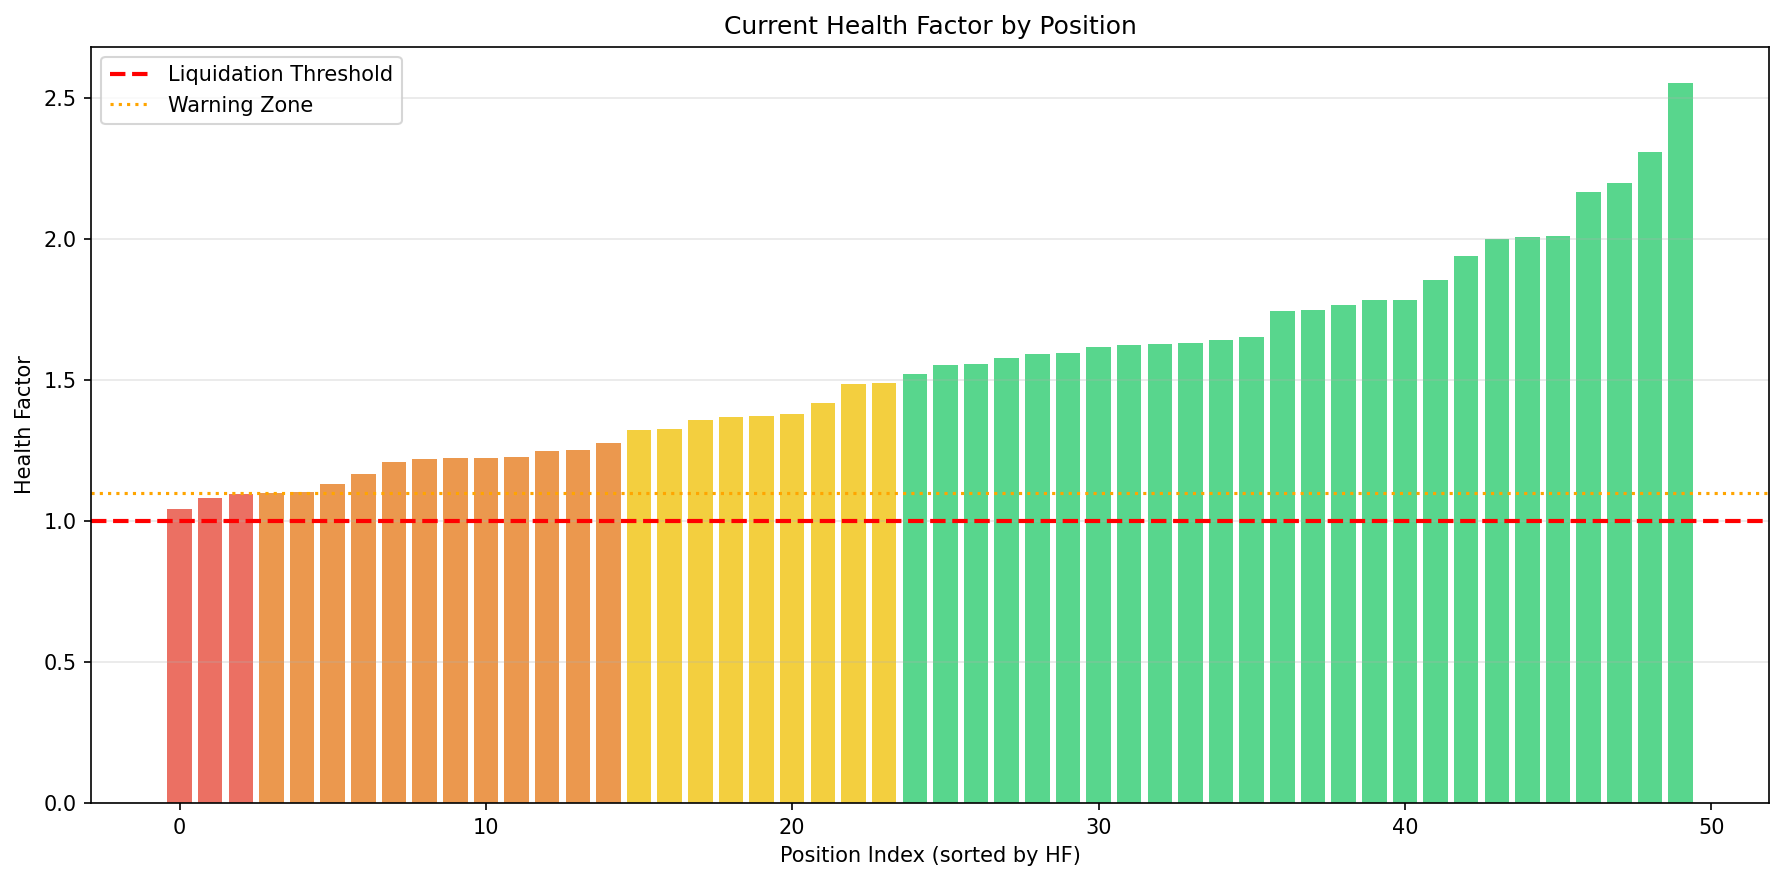
In a Morpho market, the liquidation threshold is defined by LLTV. A simplified health factor for this type of stress test is:
health factor = collateral value * LLTV / borrowed value
When the health factor falls below 1.0, the position is eligible for liquidation. One account crossing that line only means its collateral value, after applying the market's liquidation threshold, no longer supports the outstanding debt. The liquidator still needs to repay debt, receive collateral, and unwind that collateral without losing money.
Most of the ~$45.56M borrowed book remains above threshold in the 20% ETH scenario. Borrower-level analysis identifies which positions actually cross the threshold under each price path.
Historical Stress Event: August 5, 2024
A 17-20% ETH drawdown has happened before. During the August 5, 2024 market sell-off, hourly aggregated ETH/USD prices showed a fast move from roughly $2,695 to $2,235.
| Time (UTC) | ETH Price | Drop from Peak |
|---|---|---|
| Aug 4, 23:00 | $2,695.59 | Baseline |
| Aug 5, 01:00 | $2,343.51 | -13.1% |
| Aug 5, 06:00 | $2,235.97 | -17.0% |
Source: hourly aggregated Chainlink Data Feeds ETH/USD data queried through Dune Analytics. The reference period was August to September 2024.
The event is a reasonable stress test: large enough to push lending positions, but still within recent market history. If a lending market cannot tolerate a repeat of this type of move, borrowers, curators, and liquidators need to know that before the next volatility event.
Borrower Impact Under ETH Price Shocks
Using the January 27, 2026 borrower snapshot, we applied deterministic ETH price drops and recalculated which positions crossed the liquidation threshold. The debt side was treated as stable USDC debt, and WETH collateral value was reduced by the modeled ETH price move.
| ETH Price Drop | Positions Liquidatable | At-Risk Debt | At-Risk Collateral |
|---|---|---|---|
| 5% | 1 | $389,000 | ~154 WETH |
| 10% | 4 | $1,170,000 | ~455 WETH |
| 17% | 8 | ~$2,200,000 | ~820 WETH |
| 20% | 12 | $5,510,000 | ~2,074 WETH |
| 50% | 43 | $16,450,000 | ~4,633 WETH |
Source: Morpho Blue GraphQL API borrower snapshot, January 27, 2026.
The jump is non-linear. A 5% decline catches one vulnerable account. A 10% decline catches four. Around the August 5, 2024 stress level, eight positions become liquidatable. At 20%, the modeled liquidatable debt rises to $5.51M.
Liquidations would happen across different transactions and blocks. Borrowers may repay, add collateral, or be liquidated in partial chunks. Liquidators may wait for oracle updates, gas conditions, and DEX routes. Still, the table shows where the market's liquidation workload begins to cluster.
The 50% scenario is a tail comparison. The main conclusion stands without it, but it shows why liquidity depth becomes more important as shocks grow. Once liquidatable collateral moves from hundreds of WETH to thousands of WETH, execution quality becomes part of solvency.
Base DEX Liquidity Simulation
To estimate liquidation execution risk, we manually simulated WETH sales on DefiLlama Swap on Base. No transactions were executed; these are quote observations.
| WETH Sold | Approx. USD Value | Quoted Price Impact | Assessment |
|---|---|---|---|
| 500 | ~$960k | ~0.00% | Low observed impact |
| 2,500 | ~$4.8M | ~0.19% | Low observed impact |
| 5,000 | ~$9.6M | ~1.19% | Material impact |
| 12,500 | ~$24M | ~4.82% | Severe impact |
Source: DefiLlama Swap quote simulation on Base, February 6, 2026.
Under normal liquidity conditions, the 20% stress case looked manageable. The modeled $5.51M of liquidatable debt maps to collateral sales closer to the low-impact quote range than the severe-impact range. Bad debt would still require failed execution, heavier slippage, further price movement, or some combination of those factors.
DEX liquidity during a crash can look very different from a calm quote simulation. Liquidity providers can withdraw, spreads can widen, aggregators can route through thinner paths, and other sellers may be hitting the same pools at the same time. If the liquidation wave occurs while unrelated ETH holders are also selling, realized slippage can be worse than the quoted values above.
For liquidators, route quality matters. Breaking sales into smaller chunks, using multiple venues, and monitoring pool depth can reduce the chance that a profitable liquidation becomes unprofitable after slippage. For curators and lenders, supply caps should be sized against stressed exit liquidity as well as normal market TVL.
How Liquidation Cascades Form
A liquidation cascade starts when falling collateral prices push some positions below the liquidation threshold. Liquidators repay debt and receive collateral. If they sell that collateral into the market, the sale can push the collateral price lower. That lower price can make more positions liquidatable, creating another round of collateral sales.
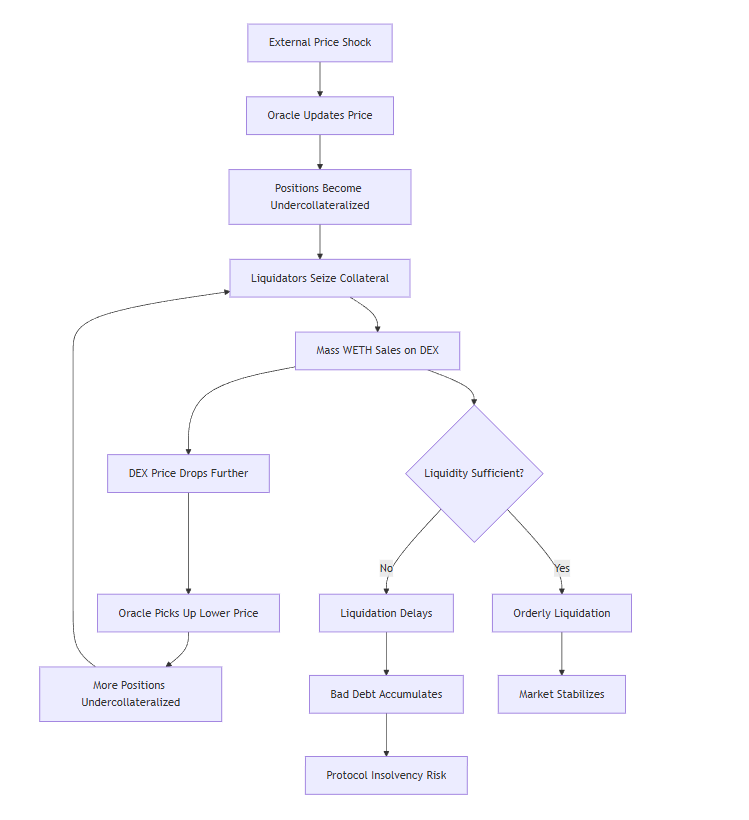
In the January 2026 snapshot, the early liquidation waves were too small to create major price impact under the February 2026 quote conditions. Risk increases when liquidatable WETH approaches the size of the market's stressed exit liquidity.
| Phase | Trigger | WETH to Sell | Observed or Modeled Slippage | Cumulative ETH Drop |
|---|---|---|---|---|
| Initial shock | External ETH sell-off | 0 | Market move | -17.0% |
| Early liquidations | Health factor below 1.0 | ~639 WETH | <0.1% quoted impact | ~-17.1% |
| 20% stress zone | More accounts cross LLTV | ~2,074 WETH | ~0.19% quote reference | ~-17.2% |
| Tail liquidity stress | Very large collateral sales | >12,000 WETH | ~4.82% quote reference | >-22% possible |
Source: borrower snapshot plus DefiLlama Swap quote simulation, February 2026.
"Cascade" describes a possible failure mode rather than a forecast. Whether it happens depends on timing, liquidity, liquidation incentives, oracle updates, and the behavior of large borrowers. The same borrower book can be safe in one market environment and fragile in another.
Oracle Behavior During Volatility
Liquidations depend on price data. If the market price of ETH moves before the on-chain oracle reflects it, liquidations can be delayed. If an oracle update captures a short-lived dislocation, borrowers can be liquidated at a price that later reverts.
We compared hourly aggregated ETH/USD values queried through Dune with raw on-chain update data indexed through The Graph during the August 5, 2024 sell-off.
| Time (UTC) | Dune Price | Graph Price | Time Diff | Deviation |
|---|---|---|---|---|
| 01:00 | $2,343.51 | $2,533.73 | 59 sec | 7.5% |
| 06:00 | $2,235.97 | $2,315.06 | 49 sec | 3.4% |
| 07:00 | $2,321.51 | $2,266.29 | 1 sec | 2.4% |
Source: internal oracleBackTest comparison using Dune Analytics and The Graph data for August 2024.
This comparison is about data methodology rather than a verdict on Chainlink correctness. Different sampling and aggregation methods can produce materially different values during fast markets, even when timestamps are close. Chainlink's own documentation notes that price feeds update based on deviation thresholds and heartbeat settings, and that consuming applications should check timestamps and define their own acceptable limits.
For lending markets, oracle reputation is only one part of the question. The liquidation design also has to handle oracle timing, update thresholds, sequencer behavior on an L2, and temporary gaps between CEX prices, DEX prices, and oracle-reported prices.
Simulation Limitations
This assessment has several limits.
-
The borrower data is a snapshot. The January 27, 2026 positions may not match current positions. Borrowers can add collateral, repay, withdraw collateral, refinance, or migrate to another market.
-
The swap simulations were collected under normal market conditions. In a real crash, liquidity providers may pull capital, active market makers may widen quotes, and unrelated sellers may compete for the same exit liquidity.
-
The analysis excludes borrower reactions. Some borrowers will act before liquidation. Others will not. The model assumes no preemptive repayment or collateral top-up.
-
The analysis excludes detailed liquidation incentives. A liquidator's realized profit depends on bonus, gas, routing, private order flow, MEV competition, and whether the collateral sale can be completed at the expected price.
-
Oracle data sources have different granularity. Dune queries and subgraph data do not represent the same data product. The comparison is a timing-sensitivity check rather than a definitive oracle-quality score.
-
User exposure can cross market boundaries. Morpho Blue market isolation can contain bad debt at the market level. However, vaults, aggregators, and curators can expose passive depositors to several markets at once. That is why vault-level exposure analysis is separate from single-market borrower analysis.
These limits define how to use the results. Treat the numbers as a structured stress test, then repeat the same process with fresh positions, fresh DEX depth, and the exact oracle configuration before making risk decisions.
Practical Recommendations
For Borrowers
Managing a WETH-backed USDC position around health factor 1.0 leaves no room for error. In this stress test, the first account becomes liquidatable after a 5% ETH move. A health factor above 1.3 gives more room to survive a 20-25% move, but the right buffer depends on position size, ability to repay quickly, and tolerance for forced liquidation.
Borrowers should set alerts before the position becomes urgent. One alert setup is an early warning around health factor 1.25, an action threshold around 1.15, and an emergency threshold around 1.05. The exact numbers can vary, but alerts at liquidation distance zero are too late.
For Vault Curators and Lenders
Size market exposure against stressed liquidity instead of headline APY. If a vault allocates to a WETH/USDC market, the curator should know how much WETH could be seized and sold under 10%, 20%, and 30% ETH shocks. Supply caps should reflect the amount of collateral that liquidators can exit without turning slippage into bad debt.
Curators should also monitor concentration. A market with many small borrowers is different from a market where a few large accounts dominate liquidation risk. The same total borrowed value can produce very different liquidation behavior depending on borrower distribution.
For Protocol and Risk Teams
Risk monitoring should combine borrower health, oracle freshness, DEX liquidity, and L2 status. Any single metric misses the interaction that creates liquidation cascades.
Useful dashboards should answer four questions:
- How much debt becomes liquidatable at each collateral price drop?
- How much collateral would liquidators need to sell?
- What is the current and stressed price impact for that collateral sale?
- Are oracle updates and L2 sequencer conditions healthy enough for liquidations to execute fairly?
For Liquidators
A fast full-size sale can be less profitable than slower execution. Large liquidations can lose money if collateral is dumped into shallow routes. Liquidators should simulate routes before execution, split trades when needed, and account for MEV competition and route failure.
Data Sources
| Source | Description | Date |
|---|---|---|
| Morpho Blue GraphQL API | Borrower positions and market parameters | Jan 27, 2026 |
| Base network information | Chain ID and network context | Reference |
| Chainlink Data Feeds | ETH/USD oracle reference and feed behavior context | Aug-Sep 2024 |
| Dune Analytics | Hourly aggregated ETH/USD query output | Aug-Sep 2024 |
| The Graph | Raw indexed oracle update comparison | Aug-Sep 2024 |
| DefiLlama Swap | Manual WETH sale quote simulation on Base | Feb 6, 2026 |
This analysis was conducted using data from the Morpho WETH/USDC market on Base. The numbers should be refreshed before using the result for live risk management.
About Us
At SC Audit Studio, we specialize in protocols security assessments. Our team of experts has worked with companies like Aave, 1Inch and several more to conduct security assessments. Partner with us to enhance your project's security and gain peace of mind.
Contact SC Audit Studio for protocol security assessments.
Explore protocols
See DeFi apps and protocols connected to this article, whether they use, implement, or relate conceptually.
Goat Tech
Explore Goat Tech on SC Audit Studio, explore audits, security insights, and more.
Tornado Cash
Explore Tornado Cash on SC Audit Studio, explore audits, security insights, and more.
Plaza Finance
Explore Plaza Finance on SC Audit Studio, explore audits, security insights, and more.
FAQ
Most important questions compiled to understand the topic better; view the following questions.